Usage and analytics
Track token usage, conversation limits, and per-agent performance analytics from the sidebar and the Analytics tab.
Mojar gives you two places to watch usage: a quick Usage meter in the sidebar for your own account limits, and a full Analytics dashboard on each agent for detailed performance data.
Sidebar usage meter
The sidebar shows a compact Usage panel near the bottom. It displays two progress bars:
- Storage — how much of your plan's storage allowance you have used (in MB), shown as
X MB of Y MB. - Conversations — how many conversations you have started against your plan's monthly limit, shown as
X of Y. If your plan has no cap, the limit shows as∞.
Each bar turns orange at 75 % and red at 90 % so you can spot pressure early. Below the bars, a line tells you when usage resets — for example, "Usage will reset Jul 15, 2026".
Clicking Usage in the sidebar takes you to the upgrade page where you can change your plan.
Context usage meter
While you are in a chat, a small circular gauge appears in the input bar. It shows what percentage of the active model's context window the current conversation is using. The gauge turns amber past 70 % and red past 85 %, which is the point where older messages start being trimmed to keep the conversation within the model's limit.
Conversation limit dialog
If you reach your plan's monthly conversation cap, a Conversation Limit Reached dialog appears when you try to start a new chat. It shows your current count against the limit and links to the upgrade page. You can still continue any conversations you already have open.
Agent analytics dashboard
Each agent has a full analytics dashboard. Open an agent, then click Analytics in the agent navigation.
Time range selector
Use the date picker at the top right to choose the period you want to analyse:
- Today
- Last 7 Days (default)
- Last 30 Days
- Last 3 Months
- Current Year
You can also click Refresh to reload the data for the selected period, or Export to download the data as CSV or PDF.
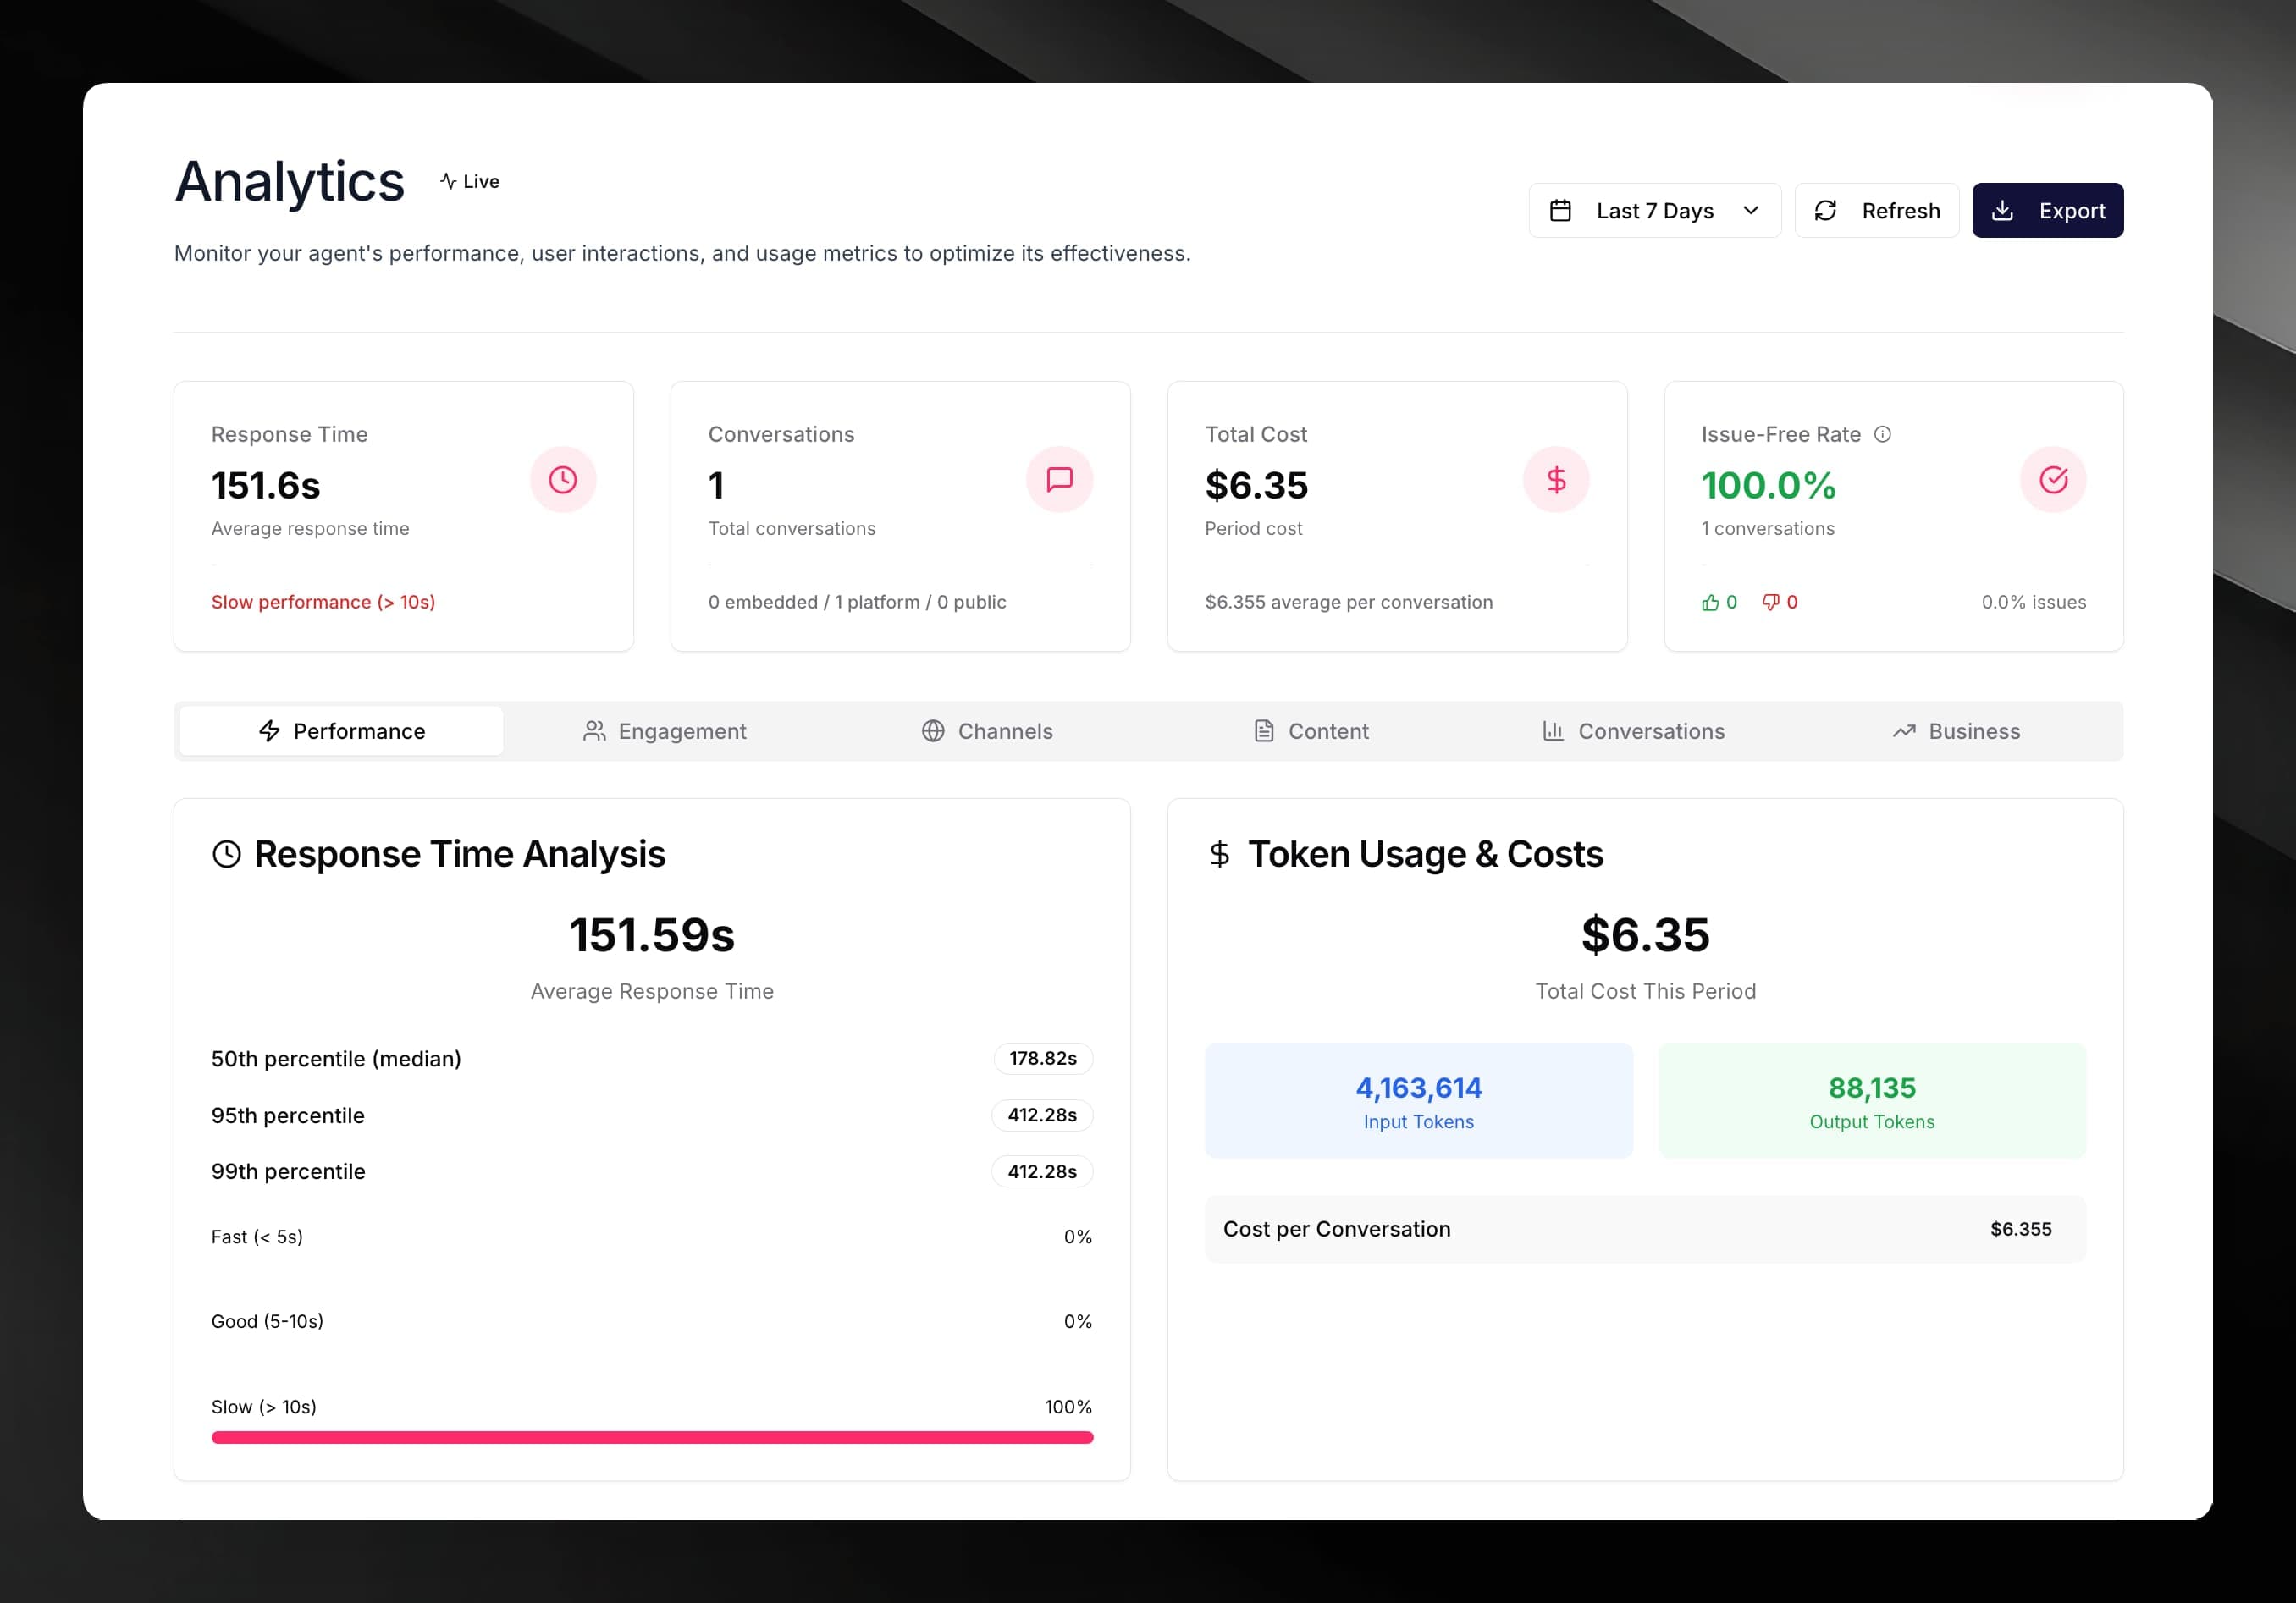
KPI summary cards
The top of the dashboard shows four summary cards for the selected period:
| Card | What it shows |
|---|---|
| Average Response Time | Mean time for the agent to reply, in seconds |
| Total Conversations | Conversations that had at least one message, across platform and embedded channels |
| Total Cost | Aggregated LLM cost for the period, with cost-per-conversation below |
| Issue-Free Rate | Percentage of conversations that received no negative feedback |
Analytics tabs
Below the KPI cards, six tabs break down the data in detail.
Performance
Shows response-time percentiles (p50, p95, p99), a distribution chart splitting responses into Fast (under 5 s), Good (5–10 s), and Slow (over 10 s), total input and output token counts, and a model-usage breakdown listing which models were used, their share of requests, and their cost.
Engagement
Shows how users are segmented (authenticated vs. guest, new vs. returning), conversation-length distribution (1–2 messages, 3–5, 6–10, 10+), a conversion funnel (guest-to-registered ratio, feedback rate, multi-session return rate), and daily / weekly / monthly retention rates.
Channels
Shows how conversations are split between the platform (logged-in users), public (guest users on the platform), and embedded (widget on external sites). For embedded channels, it lists the domains that generated the most conversations.
Content
Shows knowledge-base utilisation — which documents were retrieved most often, how many documents in the KB were unused in the period — plus a breakdown of the most frequent user query patterns and any queries that returned low-satisfaction responses (potential content gaps).
Conversations
Shows conversation-flow data: average length, completion rate, drop-off points, and average duration. Also shows message-volume patterns by hour of day and day of week, plus a satisfaction-trend chart plotting positive and negative feedback over time.
Business
Shows cost analytics: total cost, cost per user, daily cost trend, and cost broken down by model. Also shows period-over-period growth rates for users and conversations.